Examples
This page lists some example circuits in Zero. Some similar circuit examples are provided in the development repository.
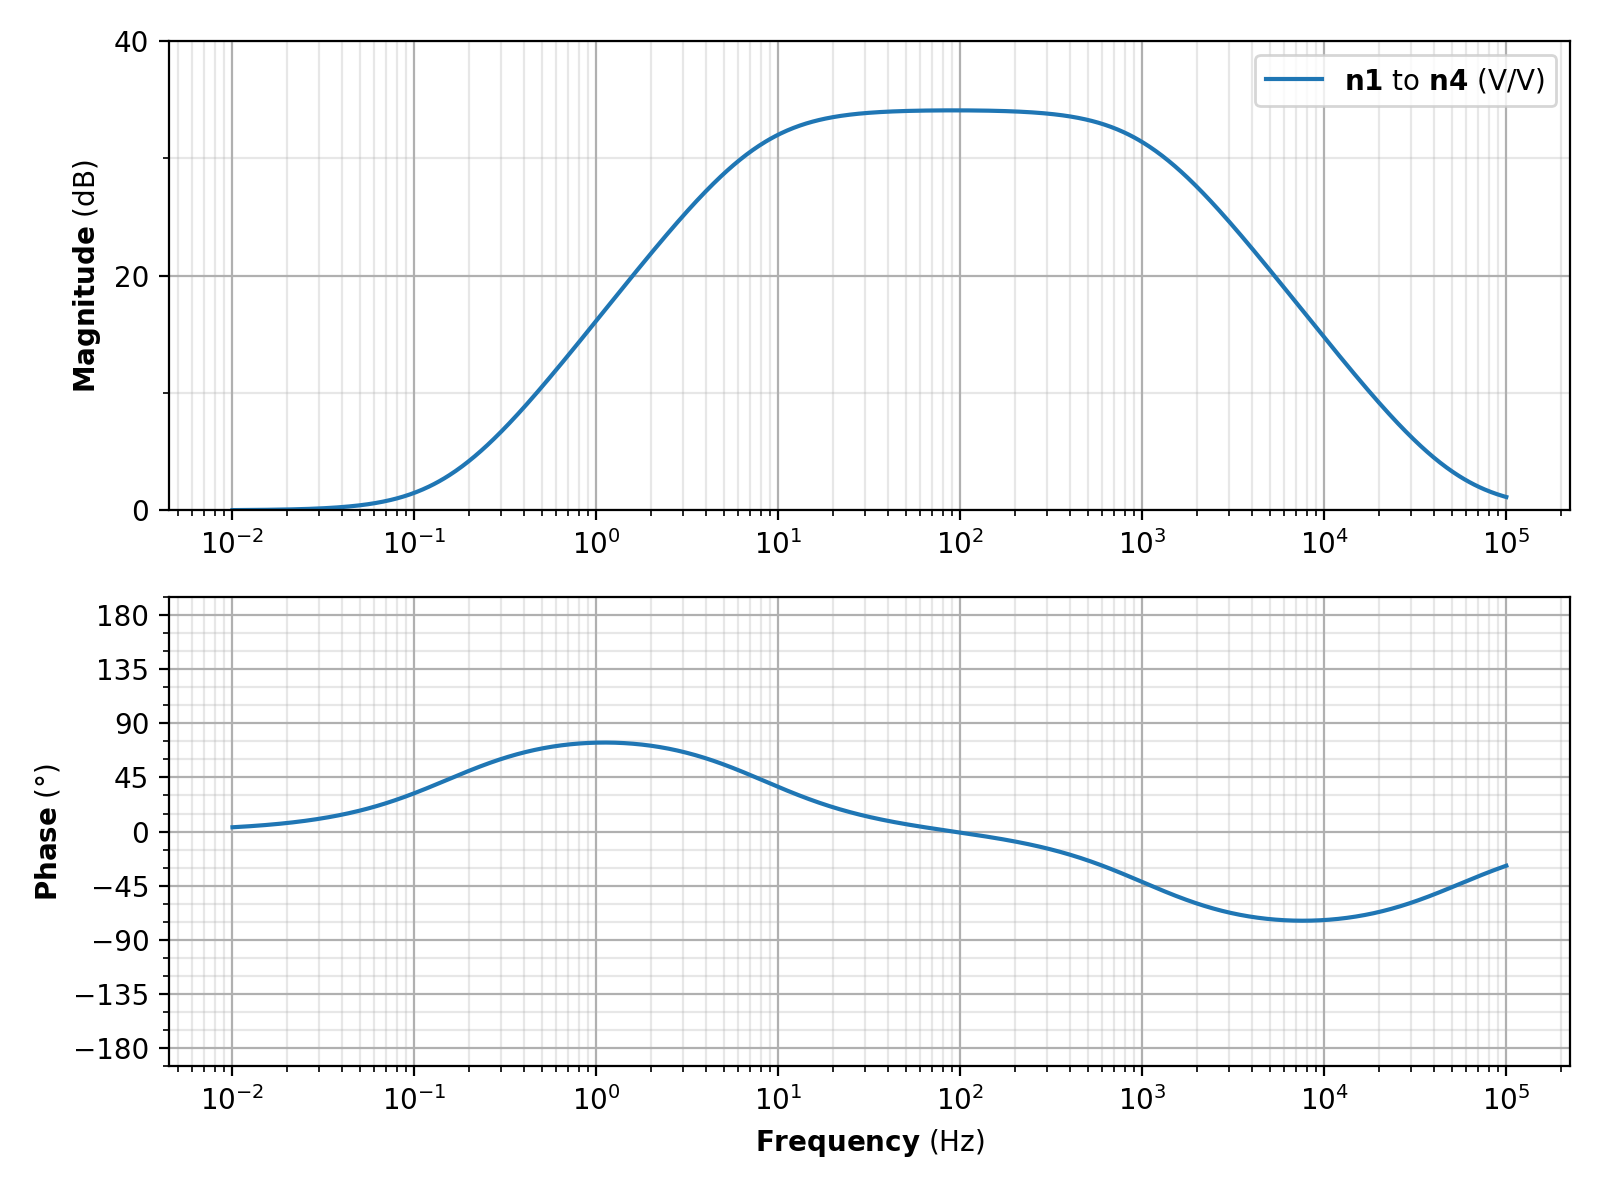
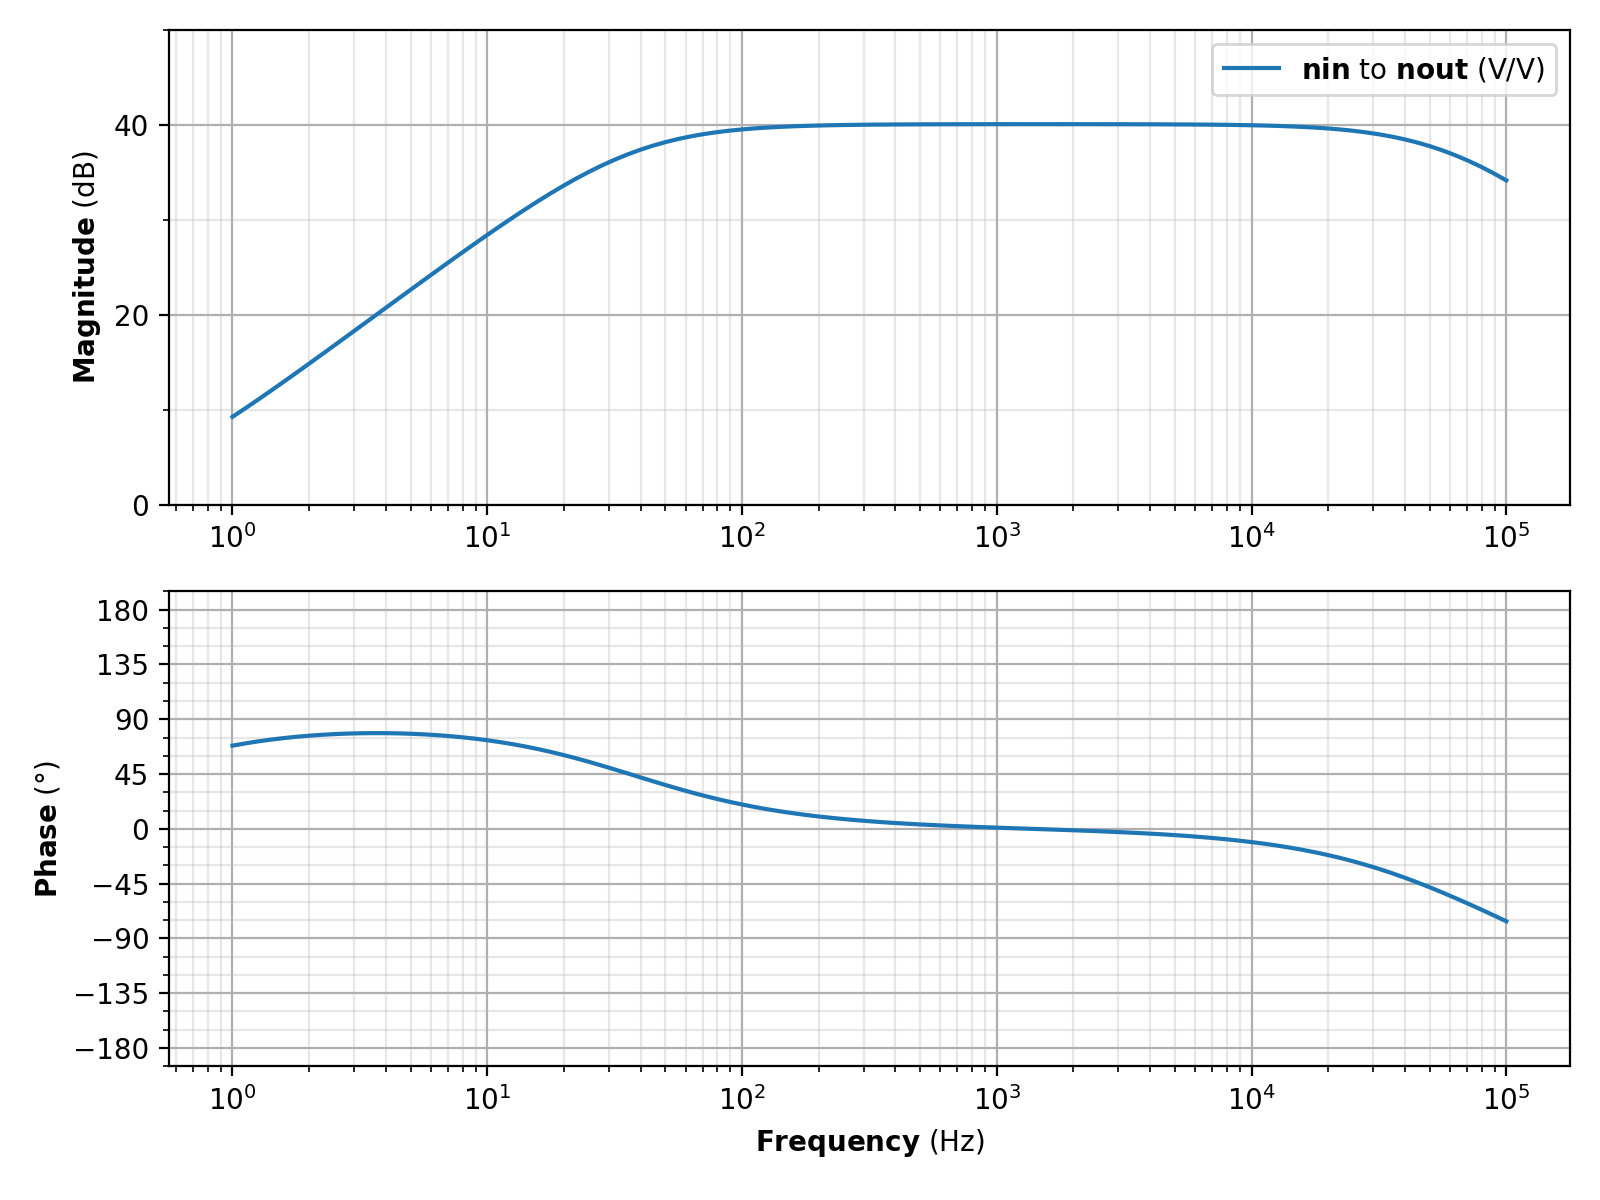
Non-inverting whitening filter response
The following is the voltage-voltage response from a non-inverting whitening filter, providing 34 dB gain between around 10 Hz to 1 kHz.
import numpy as np
from zero import Circuit
from zero.analysis import AcSignalAnalysis

# 1000 frequencies between 10 mHz to 100 kHz.
frequencies = np.logspace(-2, 5, 1000)

# Create circuit object.
circuit = Circuit()

# Add components.
circuit.add_library_opamp(model="LT1124", node1="n1", node2="n3", node3="n4")
circuit.add_capacitor(value="10u", node1="gnd", node2="n2")
circuit.add_resistor(value="2k", node1="n2", node2="n3")
circuit.add_resistor(value="100k", node1="n3", node2="n4")
circuit.add_capacitor(value="1.5n", node1="n3", node2="n4")

# Solve circuit.
analysis = AcSignalAnalysis(circuit=circuit)
solution = analysis.calculate(frequencies=frequencies, input_type="voltage", node="n1")

# Plot.
plot = solution.plot_responses(sink="n4")
plot.show()
(Source code, png, pdf)

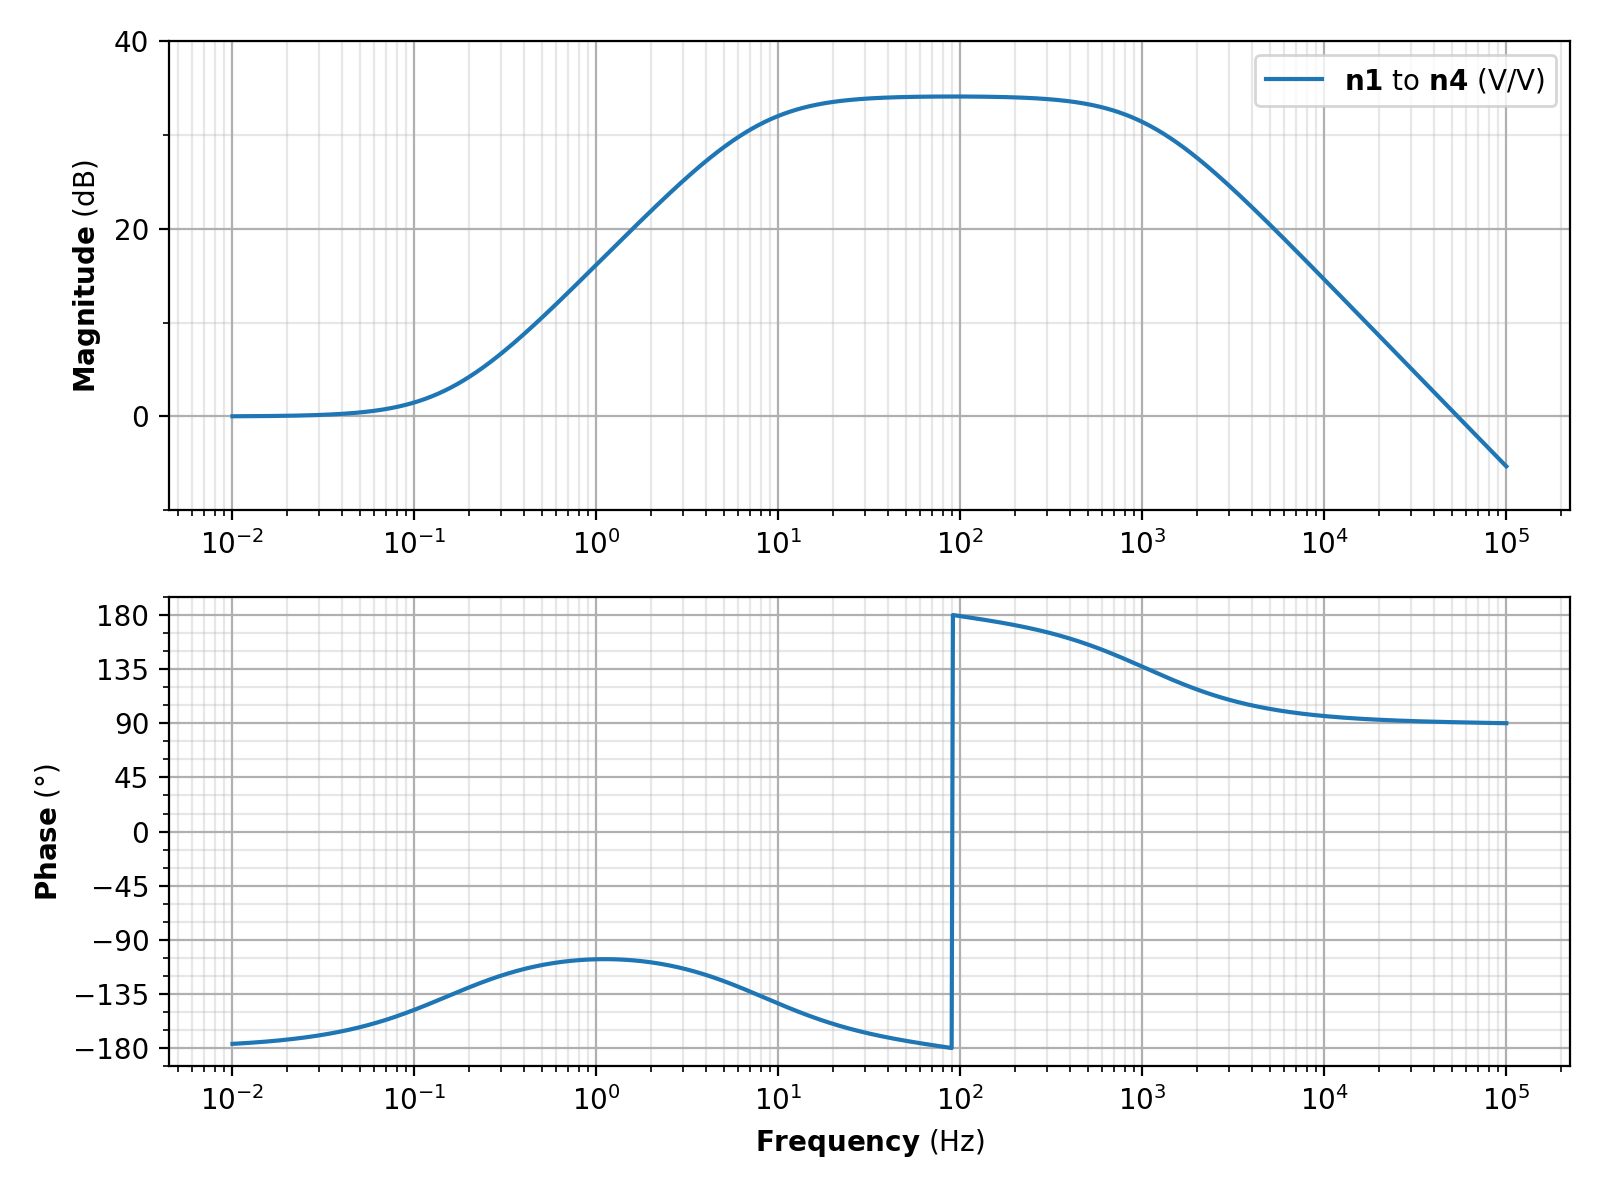
Inverting whitening filter response
The following is the voltage-voltage response from an inverting whitening filter, providing 34 dB gain between around 10 Hz to 1 kHz. The response is almost identical to the non-inverting filter above except its output has opposite sign (and the input impedance is much lower).
import numpy as np
from zero import Circuit
from zero.analysis import AcSignalAnalysis

# 1000 frequencies between 10 mHz to 100 kHz.
frequencies = np.logspace(-2, 5, 1000)

# Create circuit object.
circuit = Circuit()

# Add components.
circuit.add_capacitor(value="10u", node1="n1", node2="n2")
circuit.add_resistor(value="2k", node1="n2", node2="n3")
circuit.add_resistor(value="100k", node1="n1", node2="n3")
circuit.add_library_opamp(model="LT1124", node1="gnd", node2="n3", node3="n4")
circuit.add_resistor(value="100k", node1="n3", node2="n4")
circuit.add_capacitor(value="1.5n", node1="n3", node2="n4")

# Solve circuit.
analysis = AcSignalAnalysis(circuit=circuit)
solution = analysis.calculate(frequencies=frequencies, input_type="voltage", node="n1")

# Plot.
plot = solution.plot_responses(sink="n4")
plot.show()
(Source code, png, pdf)
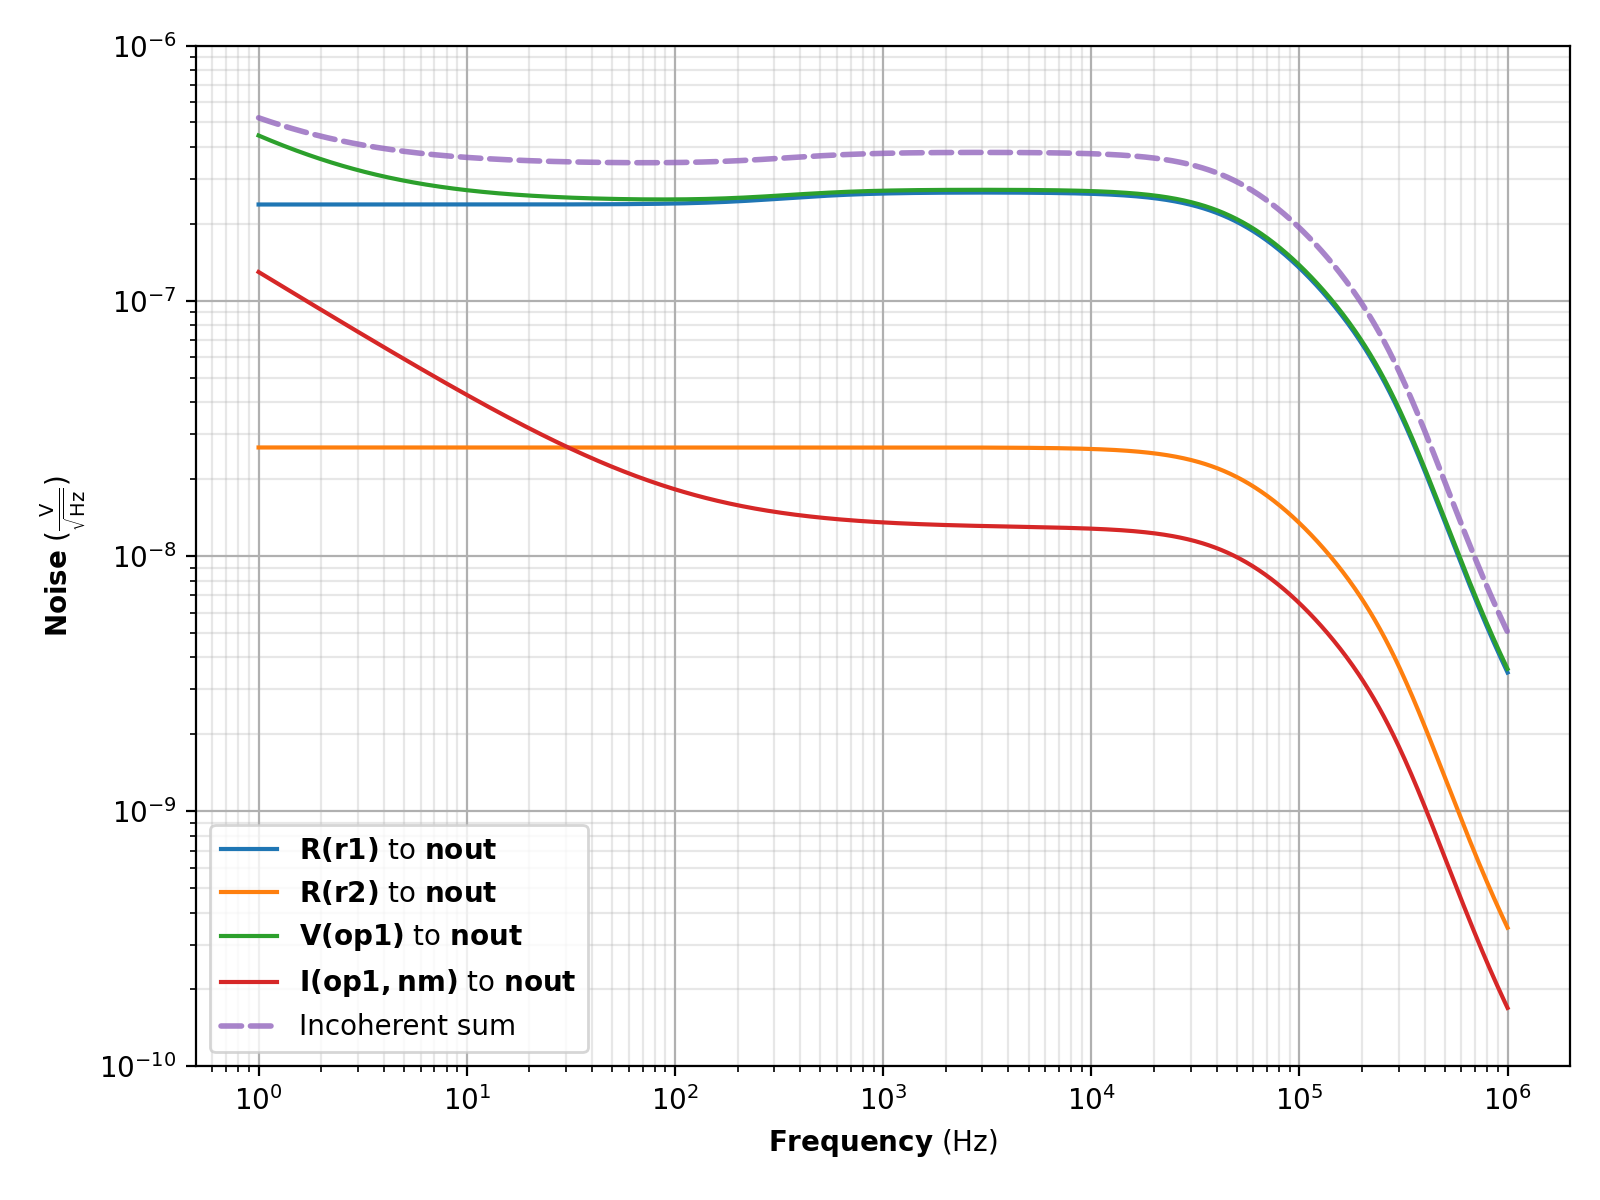
Inverting whitening filter output noise
The voltage noise at the output node (nout) can be calculated with the code below.
import numpy as np
from zero import Circuit
from zero.analysis import AcNoiseAnalysis

# 1000 frequencies between 1 Hz to 1 MHz
frequencies = np.logspace(0, 6, 1000)

# Create circuit object.
circuit = Circuit()

# Add components.
circuit.add_capacitor(value="10u", node1="gnd", node2="n1")
circuit.add_resistor(value="430", node1="n1", node2="nm", name="r1")
circuit.add_resistor(value="43k", node1="nm", node2="nout")
circuit.add_capacitor(value="47p", node1="nm", node2="nout")
circuit.add_library_opamp(model="LT1124", node1="gnd", node2="nm", node3="nout")

# Solve circuit.
analysis = AcNoiseAnalysis(circuit=circuit)
solution = analysis.calculate(frequencies=frequencies, input_type="voltage", node="n1",
                              sink="nout", incoherent_sum=True)

# Plot.
plot = solution.plot_noise(sink="nout")
plot.show()
(Source code, png, pdf)
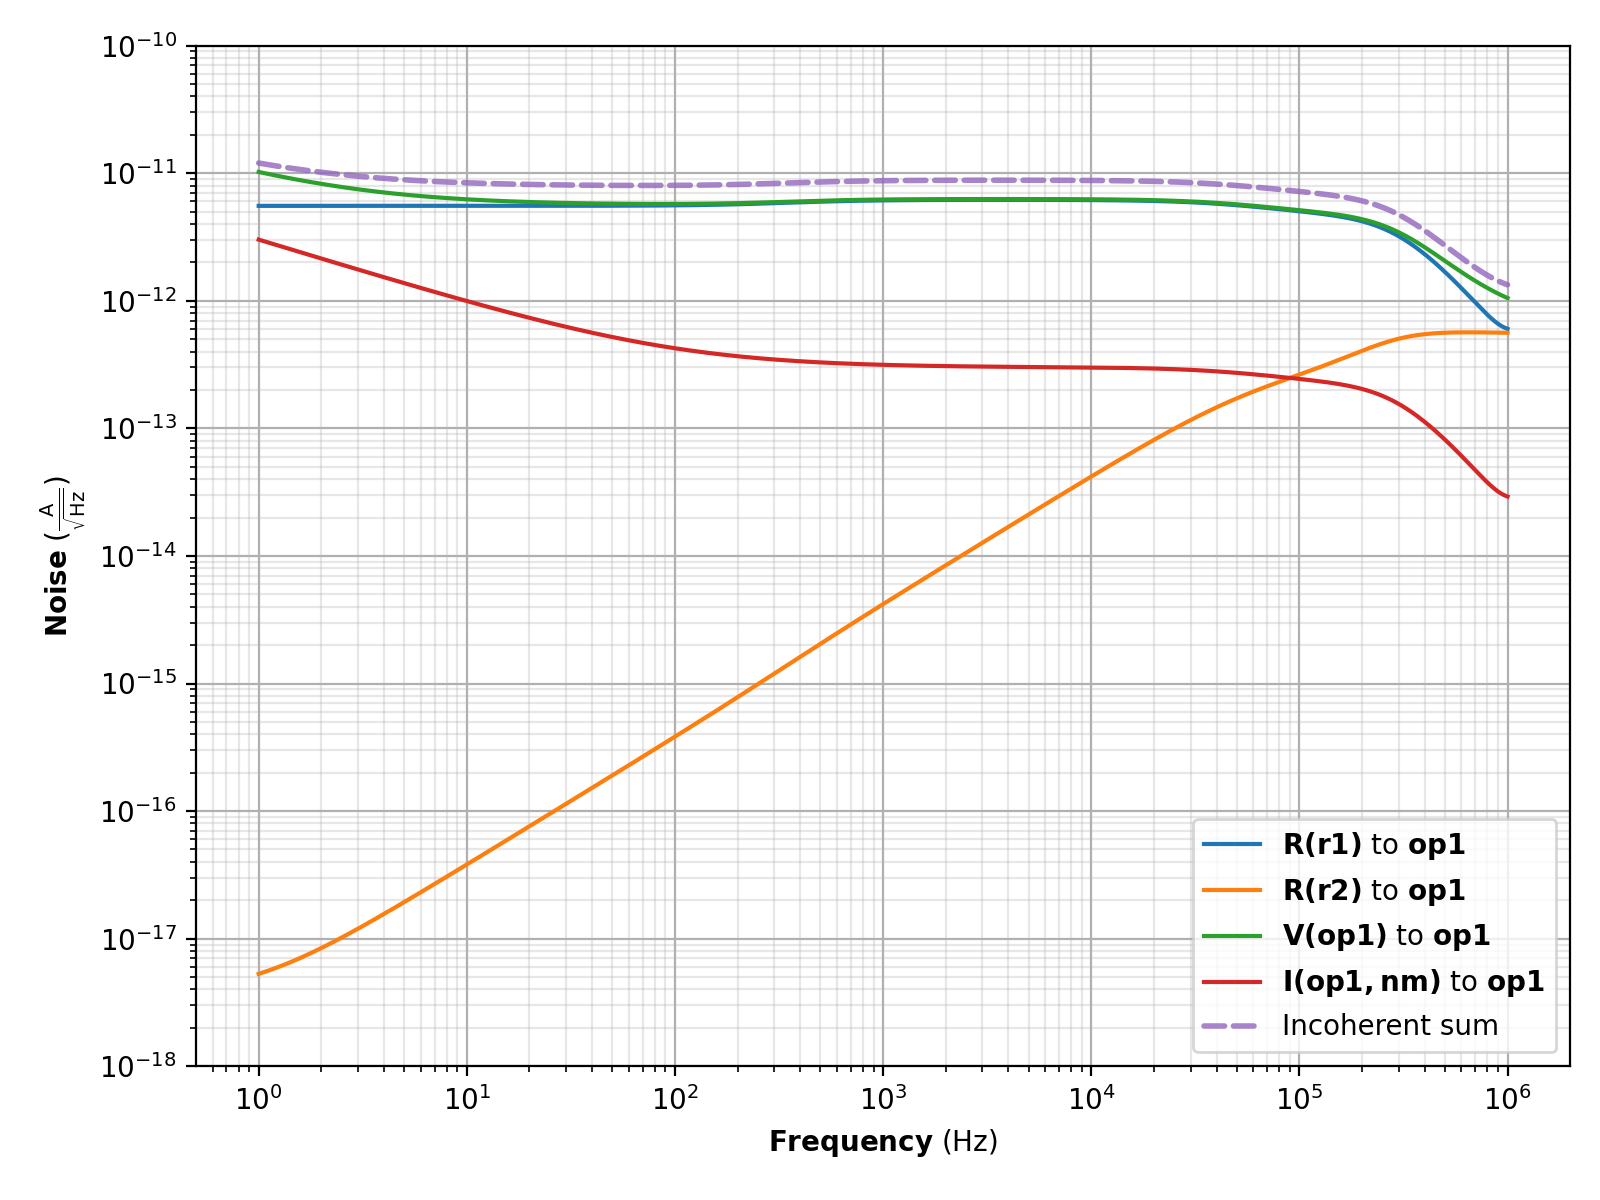
The current noise through the op-amp can be calculated with the code below. Note that it is useful to give the op-amp an explicit name in order to reference it as the noise sink.
import numpy as np
from zero import Circuit
from zero.analysis import AcNoiseAnalysis

# 1000 frequencies between 1 Hz to 1 MHz
frequencies = np.logspace(0, 6, 1000)

# Create circuit object.
circuit = Circuit()

# Add components.
circuit.add_capacitor(value="10u", node1="gnd", node2="n1")
circuit.add_resistor(value="430", node1="n1", node2="nm", name="r1")
circuit.add_resistor(value="43k", node1="nm", node2="nout")
circuit.add_capacitor(value="47p", node1="nm", node2="nout")
circuit.add_library_opamp(name="op1", model="LT1124", node1="gnd", node2="nm", node3="nout")

# Solve circuit.
analysis = AcNoiseAnalysis(circuit=circuit)
solution = analysis.calculate(frequencies=frequencies, input_type="voltage", node="n1",
                              sink="op1", incoherent_sum=True)

# Plot.
plot = solution.plot_noise(sink="op1")
plot.show()
(Source code, png, pdf)

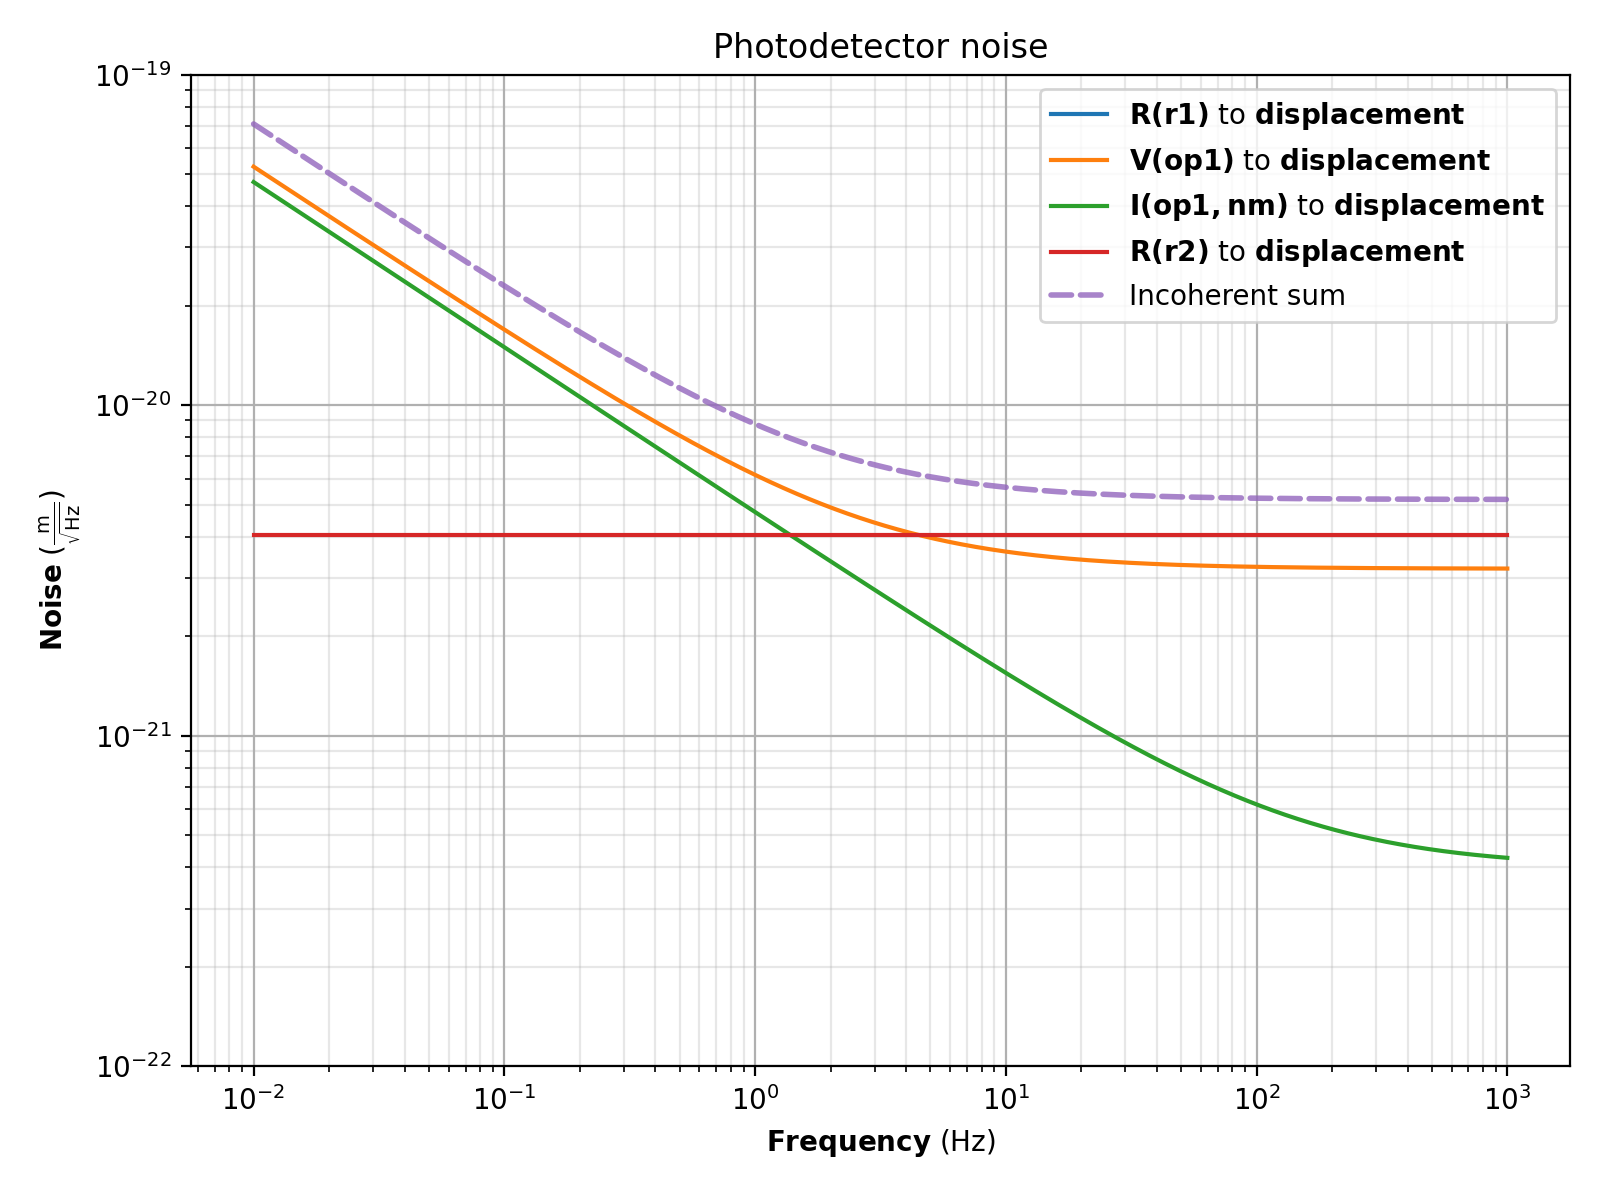
Input-projected photodetector readout noise
With photodetectors used in optics experiments, it is often very useful to present the readout noise
from the electronics in terms of the equivalent input noise. Photodiodes used at the input of these
readout circuits can usually be considered as current sources, so projecting the noise to the input
involves projecting into units of A/sqrt(Hz). It is often yet more useful to scale this input
noise some other unit, such as displacement (useful for instance in interferometer experiments).
The example here shows the projection of the total output voltage noise to the equivalent input
current noise and the scaling of the input current noise to displacement noise.
import numpy as np
from zero import Circuit
from zero.analysis import AcNoiseAnalysis
from zero.tools import create_response

# 1000 frequencies between 10 mHz to 1 kHz
frequencies = np.logspace(-2, 3, 1000)

# Create circuit object.
circuit = Circuit()

# The photodiode is a current source that connects through a photodiode circuit model (shunt
# capacitor and series resistor).
circuit.add_capacitor(value="200p", node1="gnd", node2="nd")
circuit.add_resistor(value="10", node1="nd", node2="nm")

# Transimpedance amplifier.
circuit.add_library_opamp(model="OP27", node1="gnd", node2="nm", node3="nout")
circuit.add_resistor(value="1k", node1="nm", node2="nout")

# Solve circuit. Assume an input impedance of 1 GΩ for the photodiode.
analysis = AcNoiseAnalysis(circuit=circuit)
solution = analysis.calculate(frequencies=frequencies, input_type="current", node="nd",
                              sink="nout", impedance="1G", incoherent_sum=True,
                              input_refer=True)

# Scale all noise at the input to displacement (response assumed to be 1 nm/A).
pd_to_displacement = create_response(source="input", sink="displacement", source_unit="A",
                                     sink_unit="m", data=1e-9*np.ones_like(frequencies),
                                     frequencies=frequencies)
solution.scale_noise(pd_to_displacement, sink="input")

# Plot. Note that the sink is now the input, since we projected the noise there. We also set a
# y-limit so the plot doesn't expand to show the (very small) resistor noise.
plot = solution.plot_noise(sink="displacement", title="Photodetector noise",
                           ylim=(1e-22, 1e-19))
plot.show()
(Source code, png, pdf)
LISO scripts
Input file parsing
Zero is capable of parsing most LISO input files. To start, create a new parser:
from zero.liso import LisoInputParser

parser = LisoInputParser()
To parse a LISO circuit, either call the parse() method with text:
parser.parse("""
c c1 10u gnd n1
r r1 430 n1 nm
r r2 43k nm nout
c c2 47p nm nout
op op1 lt1124 nin nm nout

freq log 1 100k 100

uinput nin 0
uoutput nout:db:deg
""")
Or point it to a file using the path parameter:
parser.parse(path="/path/to/liso/script.fil")
Get the solution with solution() and plot and show it with
Solution.plot() and Solution.show():
solution = parser.solution()
solution.plot()
solution.show()
(Source code, png, pdf)
You can at any time list the circuit’s constituent components with print(parser.circuit):
Circuit with 6 components and 5 nodes

    1. c1 [in=gnd, out=n1, C=1e-05]
    2. c2 [in=nm, out=nout, C=4.7e-11]
    3. input [in=gnd, out=nin, Z=default]
    4. op1 [in+=nin, in-=nm, out=nout, model=LT1124]
    5. r1 [in=n1, out=nm, R=430.0]
    6. r2 [in=nm, out=nout, R=43000.0]
Generating a circuit graph
You can plot the circuit’s node network using Graphviz, if installed. Using the circuit from the above example, the following code will generate and open a PDF of the circuit’s node network:
from zero.display import NodeGraph
graph = NodeGraph(circuit)
graph.view_pdf()

Graphviz almost always produces a messy representation, but it can sometimes be useful to help spot simple mistakes in circuit definitions.