Stationarity
What does this task do?
This task computes the variance of the SNR calculation from matched filtering. This gives us an idea of how stationary the detector data are. A value of 1 indicates close to Gaussian noise. Through injection studes we have determined a value greater than 2 indicates the data are not stationary and typically should not be due to a real GW. This monitor also generates an OmegaScan of h(t) and draws a box to highlight which detector data have been considered when determining if the data are stationary.
A presentation on this work can be found at DCC: G1900224. This is the first stage of this monitor and we expect to make further improvements to this monitor in the coming months.
What are its return states?
human_input_needed
error
How was it reviewed?
This has not been reviewed!
How should results be interpreted?
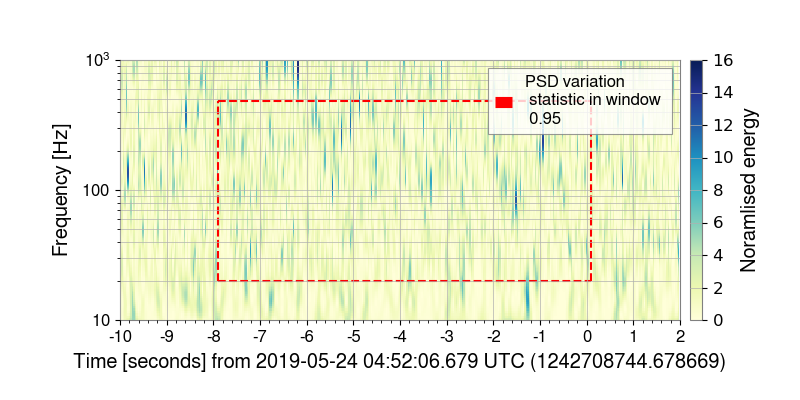
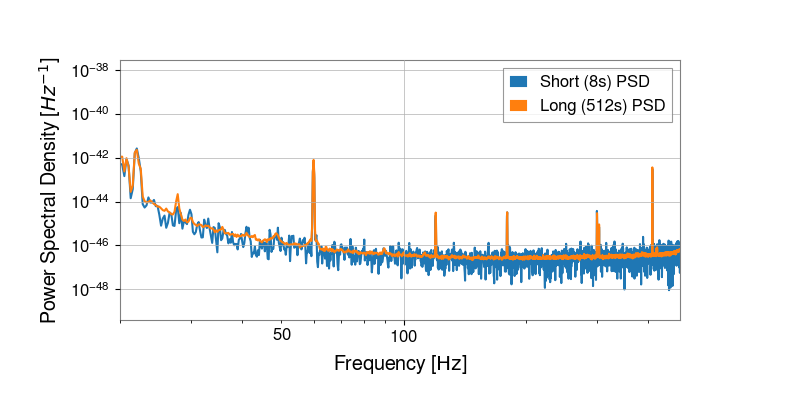
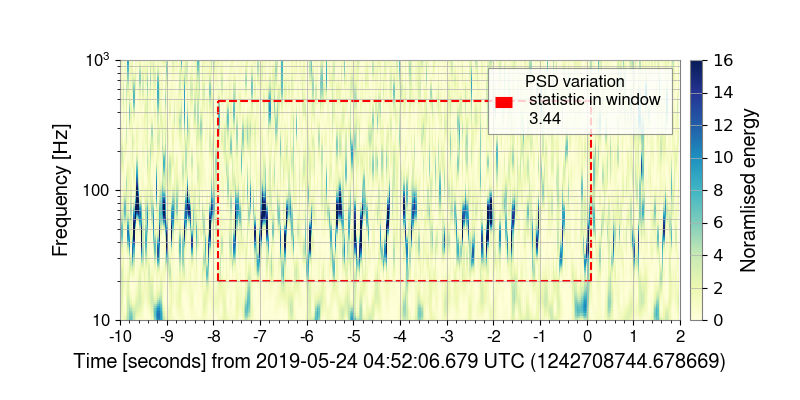
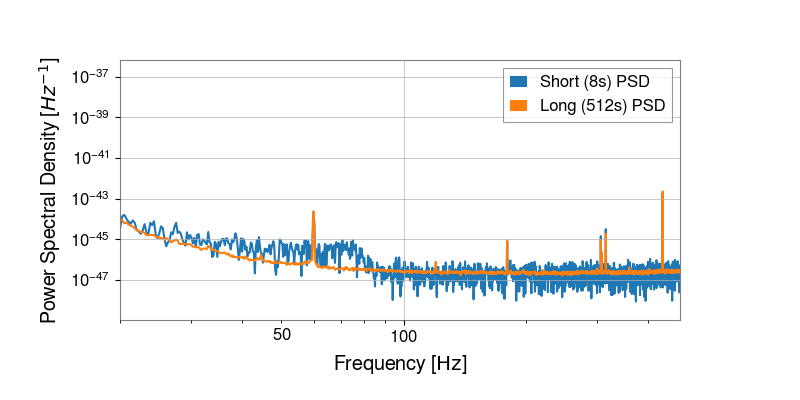
This task is assessing the stationarity of the data around an event. You will see two plots and a table indicating the stationarity statistic and whether this statistic value indicates there is evidence of non-stationarity.
The top plot is an omegscan of the data around the event. The event is at a time of zero. The red dashed box indicates the time and frequency region over which the statistic has been calculated. Part of the statistic compares the PSD around the event time and over a longer period of time. The bottom plot shows these two PSDs. The shorter PSD is estimated over the event. For example, an 8 second PSD indicates a PSD estimated over [-7.9s, +0.1s] of the event time. The longer PSD is calculated over the time specified with the event time being at the central time of the PSD. For a 512 second PSD, this means the PSD is estimated [-256s, +256s] of the event time. This window is the same for any type of event. With this plot we are assessing if the PSDs are remarkably different, as this could indicate the SNR of the event could be inflated. The table underneath the two plots give the statistic value.
If the returned statistic value is less than 2 this task is passed. A value above 2 does not necessarily receive a fail state. Above a value of 2, the task is indicating there is non-stationarity in the data, which can mean that the SNR of the candidate event is inflated, i.e. the non-stationary data is increasing the significance of a candidate event. Compare the omegascan in this task to omegascans in the Gravity Spy, Omegascans, and PEM tasks. For any identified excess noise present, work with search and PE experts to evaluate the impact over the time and frequency range indicated and advise on appropriate mitigation methods (i.e. gating, linear subtraction with a witness, glitch model subtraction, veto/retraction, etc.). For example, shorter templates are more likely to be affected by non-stationarity compared to longer templates.
Below are examples taken from S190524q. These plots show the data at LHO to be close to Gaussian:
Whereas the plots of LLO show the data to be non-stationary:
What INI options, config files are required?
At the moment this monitor only uses hard coded variables which are defined in the monitor. No config file is needed. The only inputs are the gps time of the trigger and the tag to indicate which detector the monitor is analysing.
Are there any derived tasks that are based on this one?
H1 stationarity
L1 stationarity
V1 stationarity
K1 stationarity
G1 stationarity


