pemcheck
What does this task do?
This task runs OmegaScans for a list of PEM channels covering the duration of an event. Coupling functions are used to estimate the worst-case contribution of a PEM channel to the GW signal. A channel requires examination if its estimated peak amplitude in DARM exceeds one tenth of the DARM background at that frequency.
What are its return states?
human_input_needed
error
How was it reviewed?
This has not been reviewed!
How should results be interpreted?
Physical Environment Monitor (PEM) checks are based on PEM injections [1, 2, 3], which measure the coupling between environment noise as witnessed by the PEM sensor array and DARM (differential arm length) for a set of injected frequencies.
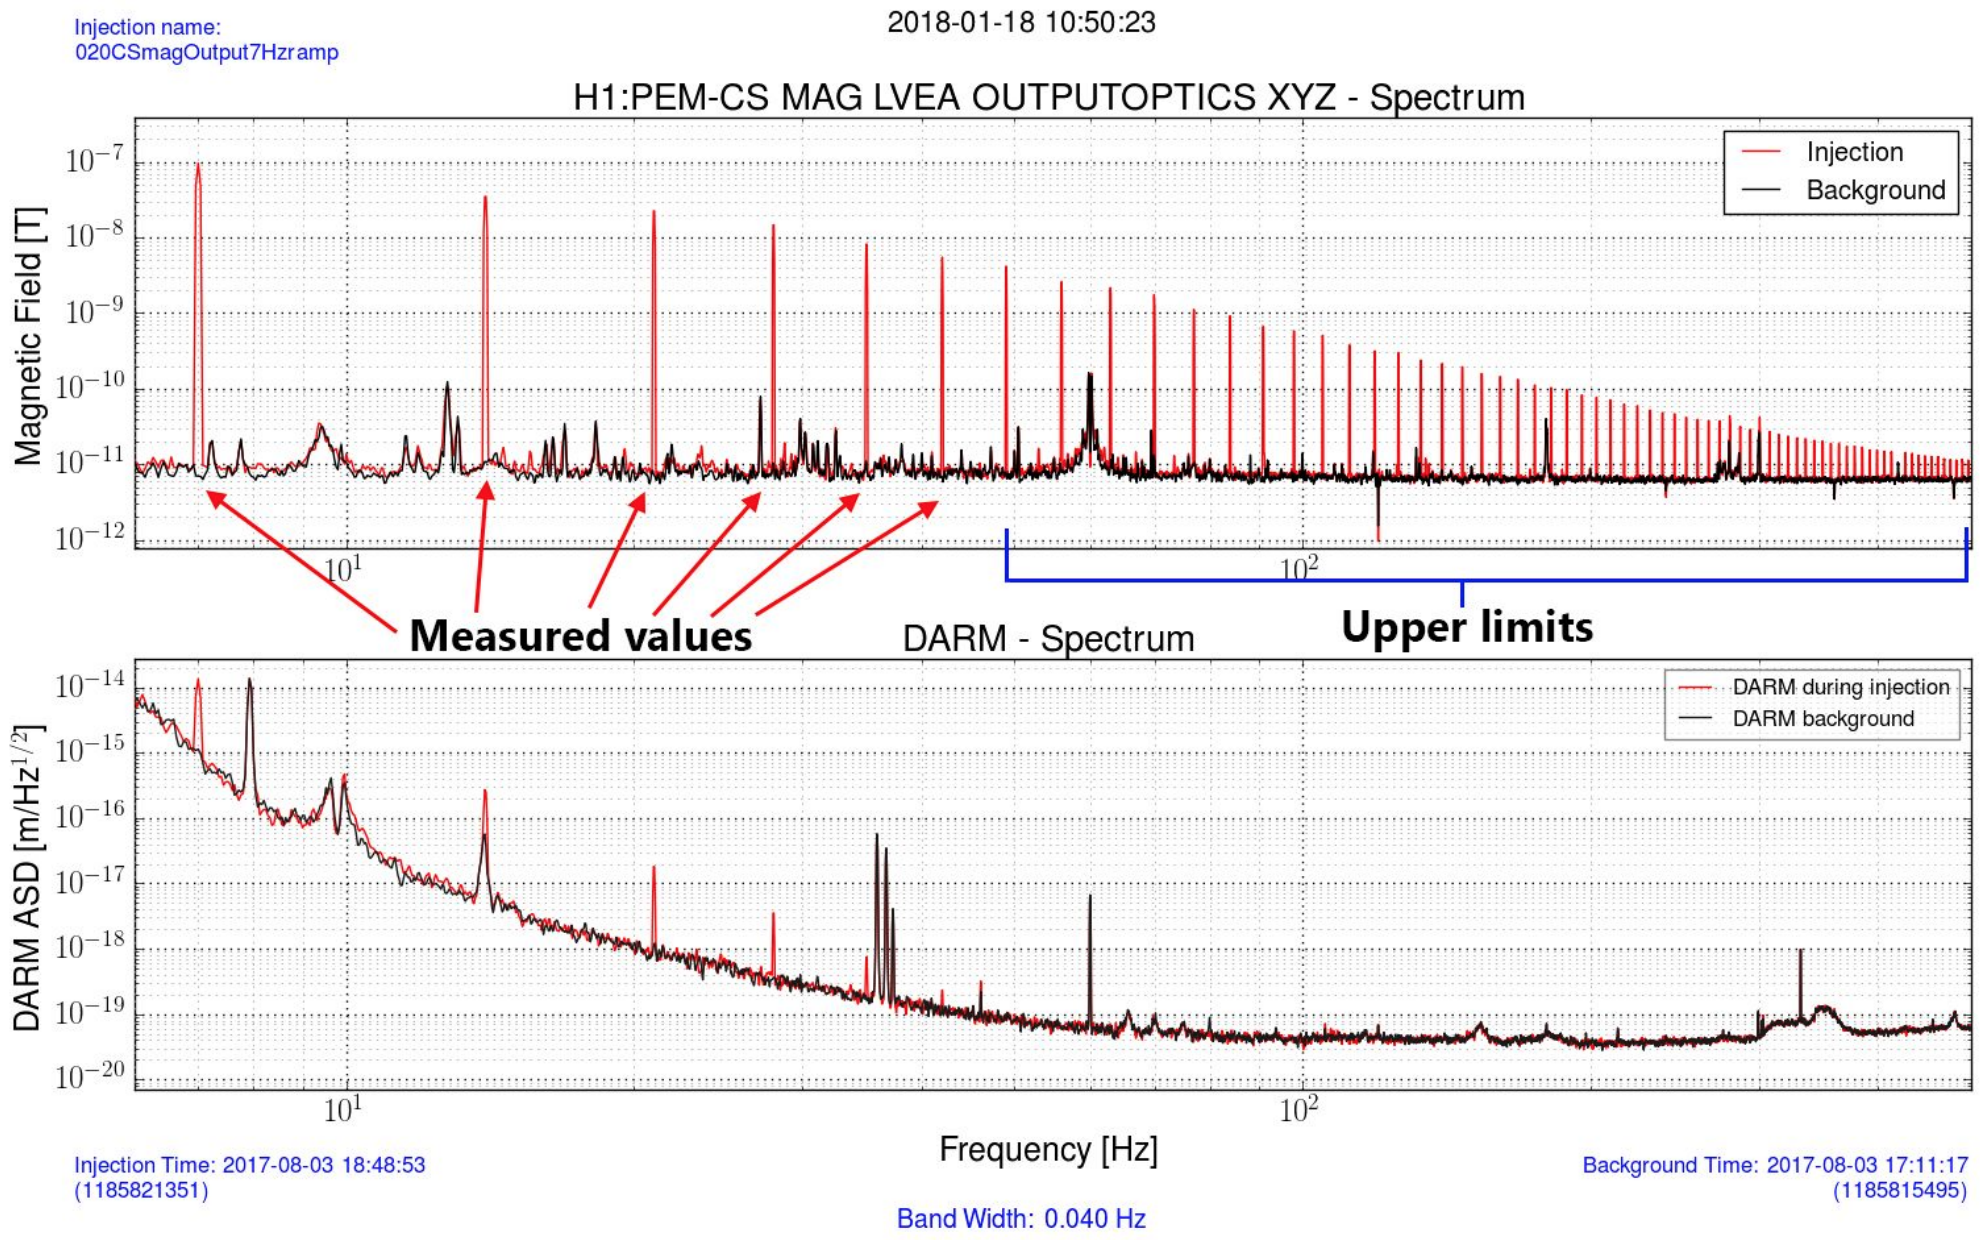
An example for a magnetic field injection set (from Philippe Nguyen’s Jan 2018 presentation to DetChar, LIGO-G1800121) is below. For each injected frequency, the amplitude witnessed by the PEM sensor and by DARM is measured and compared to a quiet background time (usually within roughly an hour of the time of the injection).
If an injection is clearly witnessed in both the PEM sensor and DARM for an injected frequency, that frequency is noted in the coupling function as a measured value. If the injection is clearly witnessed in the PEM sensor but not DARM, it is noted as an upper limit at that frequency. If the injection is not clearly witnessed in either DARM or the PEM sensor, it is marked as thresholds not met at that frequency. [The threshold for “clearly witnessed” is defined as the ratio of injection ASD to background ASD; usually 3 for PEM sensors and 2 for DARM.]
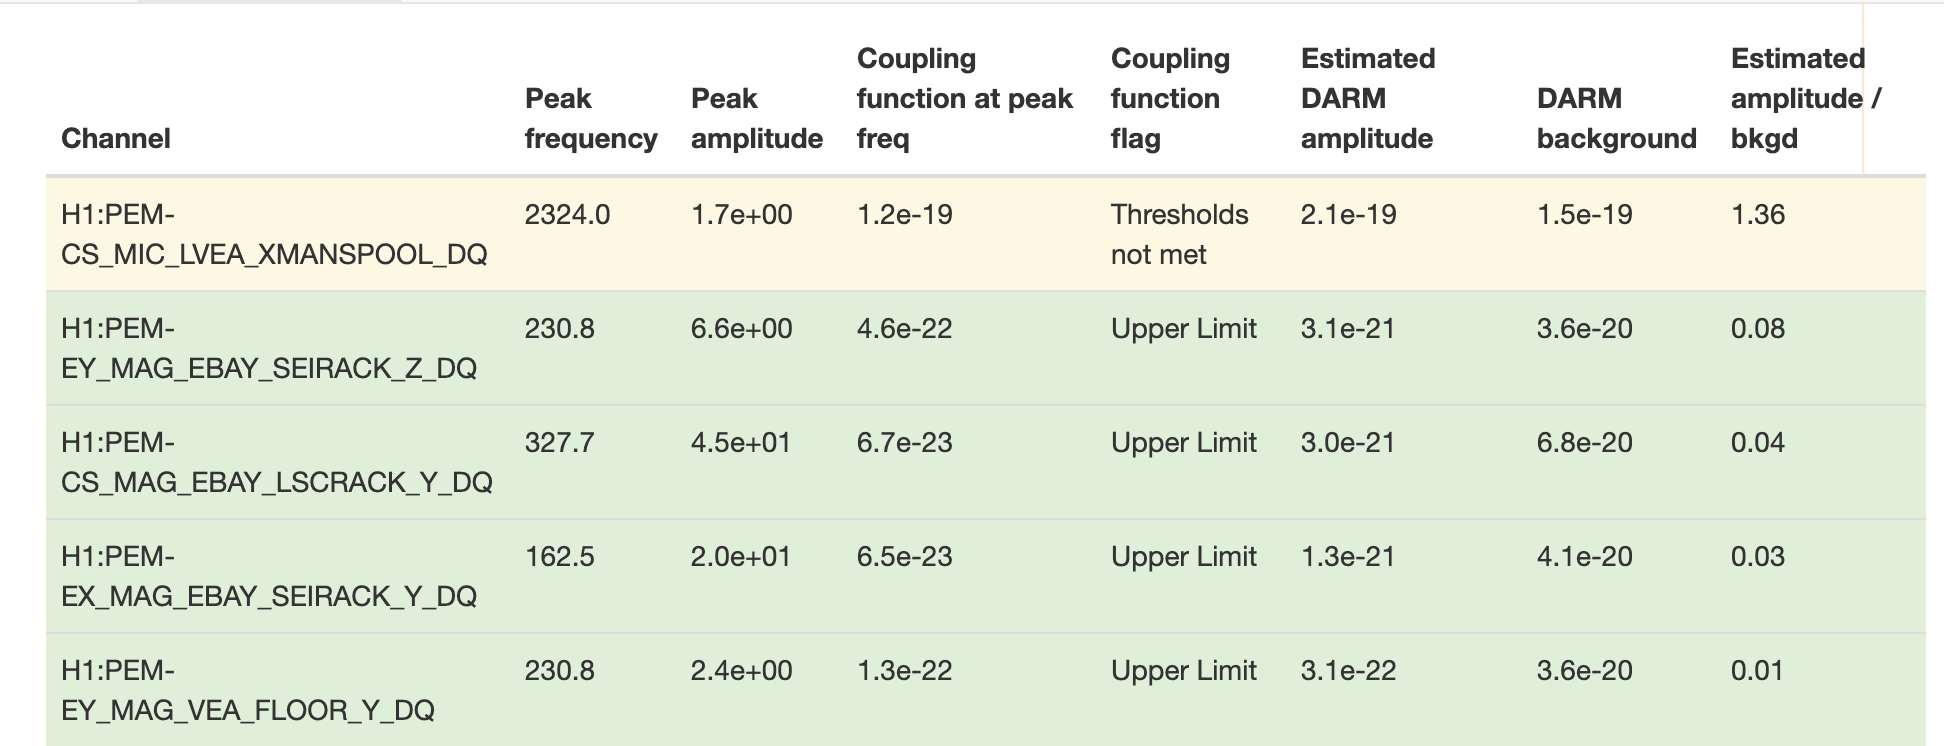
For each LIGO detector, review the PEM check table in the DQR. An example is below, with documentation of each column (also from Nguyen 2018, LIGO-G1800121):
Channel: the channel name for each PEM sensor. See pem.ligo.org for documentation of sensor types and locations.
Peak frequency: the central frequency of the most significant time-frequency tile in the PEM channel data within the time analyzed, as calculated by the Omega algorithm.
Peak amplitude: the amplitude of the most significant time-frequency tile in the PEM channel data within the time analyzed, as calculated by Omega.
Coupling function at peak freq: the value of the coupling function between the PEM sensor and DARM (measured with PEM injections), at the peak frequency of the PEM channel data around the time of the superevent trigger. Note that coupling function values are interpolated to the injection frequency nearest to the PEM channel peak frequency (within 10 Hz).
Coupling function flag: the coupling function value for a given frequency is classified as ‘measured value’, ‘upper limit’, or ‘thresholds not met’ based on the outcome of the PEM injection set for that sensor, as described above.
Estimated DARM amplitude: the peak amplitude of the PEM channel data multiplied by the coupling function at the peak frequency.
DARM background: the DARM amplitude at the PEM channel data’s peak frequency as measured for the PEM injection used to generate the coupling function.
Estimated amplitude/bkgd: The ratio of the estimated DARM amplitude contributed by the environmental noise as witnessed by this sensor over the DARM background at the peak frequency.
For every PEM channel with an estimated ‘estimated amplitude/bkgd’ of 0.1 of above (highlighted in yellow):
Review the full Omegascan results linked at the top of the ‘pemcheck’ task for excess power in the indicated PEM sensor(s) that overlaps with the signal track. Use the ‘preferred event’ of the superevent trigger for reference.
If there is excess power that overlaps the signal track, consult with PEM experts (robert.schofield@LIGO.org) to evaluate the need to repeat the PEM coupling measurement for the current interferometer configuration. (Any significant changes to the detector since the last coupling measurement was made? Any possibility of drift in coupling value over the scale of ~months?)
In the case of unusual events, PEM experts should be consulted if any channels exceed the h(t) coupling threshold even if there is no overlap with excess power in h(t).
Jointly with PEM and search/PE experts, evaluate the impact of any identified environmental noise on the reported trigger and recommend appropriate mitigation (i.e. gating, linear subtraction with a PEM witness, glitch model subtraction, veto, etc.).
Be sure to note your PEM check recommendations explicitly in the event validation report - PEM sensor checks are an important ‘zero lag’ noise check.
What INI options, config files are required?
path-to-coupling-functions (string)
the .h5 file containing PEM coupling functions.
delay (float)
the number of seconds to wait before querying data. This allows us to reasonably guarantee that data is discoverable through standard tools (gw_data_find).
Are there any derived tasks that are based on this one?
The following reference PEM channel lists stored within the DQR source code.
H1 pemcheck
L1 pemcheck

