Hierarchical Layout
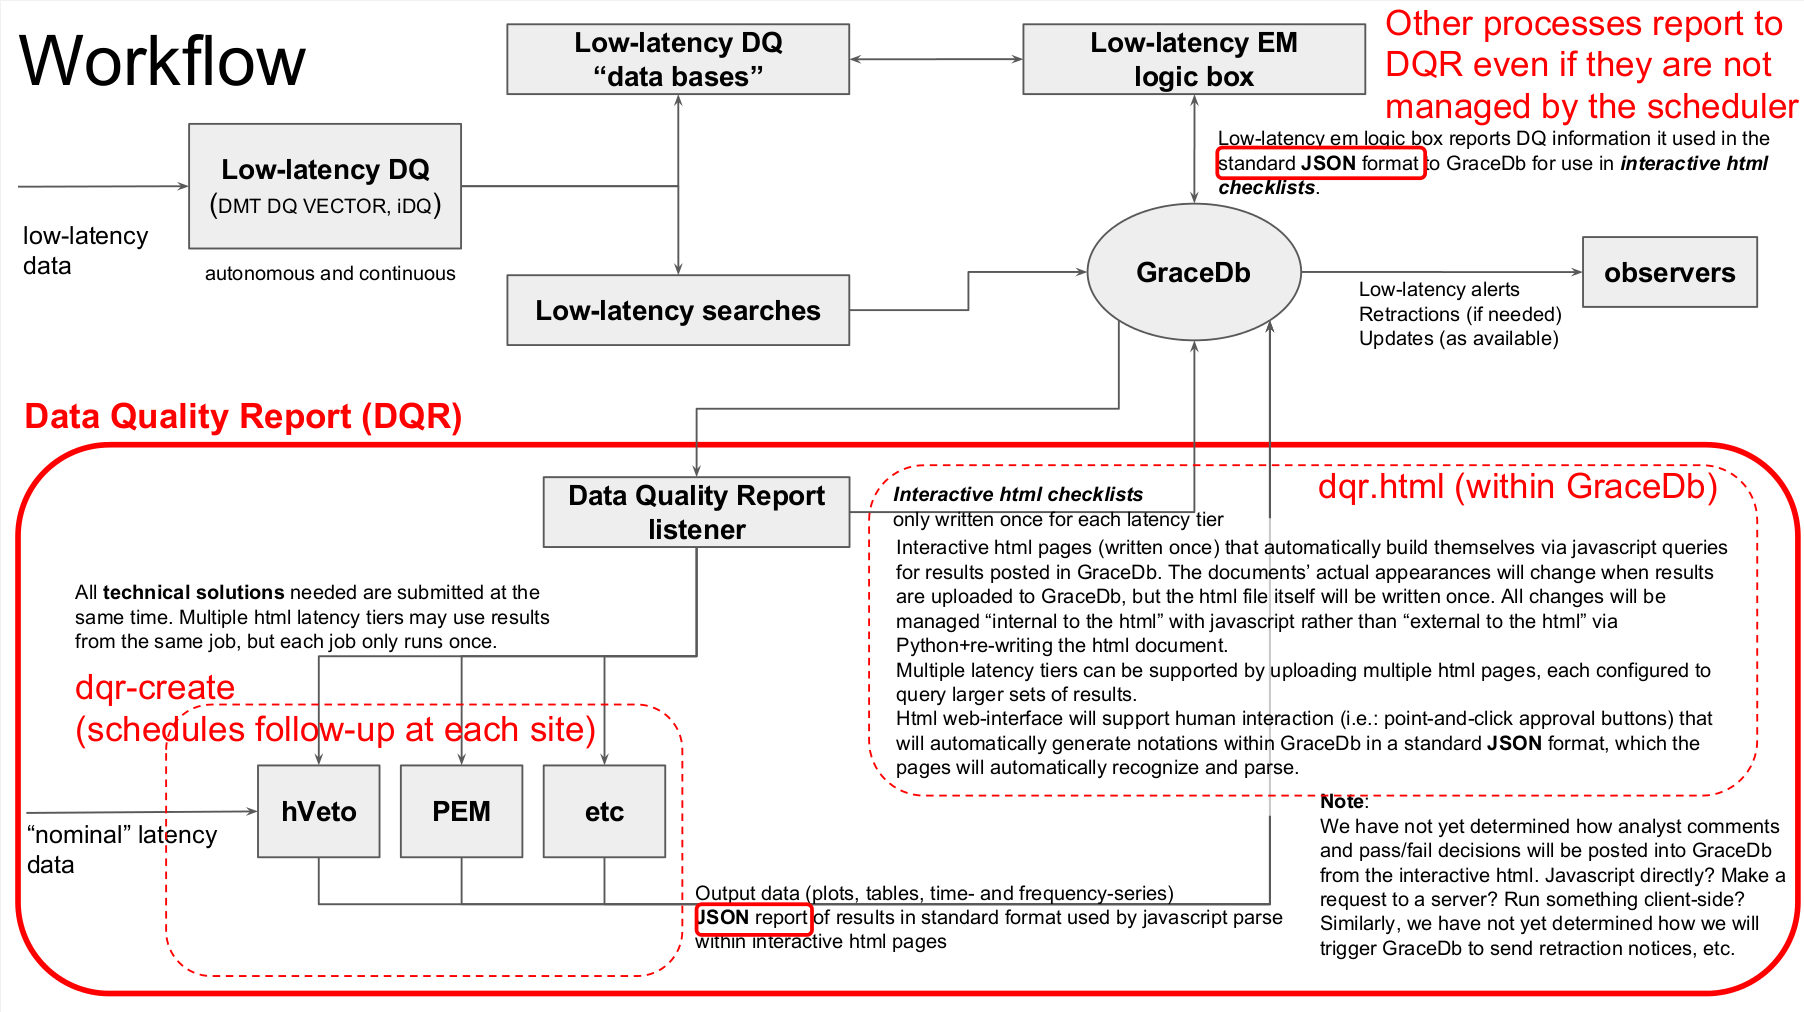
The Data Quality Report (DQR) is a way to unify the reporting format for many different data quality products associated with candidate events. We briefly summarize the organizational structure within the DQR below, and a more complete discussion is provided in the design document. Briefly, the general DQR workflow is placed in context of other processes in this flowchart:
Tiers
Different products may be available with different latencies, and it may be important to provide updates on intermediate timescales instead of waiting for everything to complete. For this reason, the DQR supports several tiers of information. While not strictly required to follow the latency of products assigned to each, that is the natural use-case. Furthermore, tiers inherit their content hierarchically; everything assigned to tier=i is included in tier>=i. Therefore, low-latency products are automatically included in high-latency reports. For example, we expect (require) low-latency checks performed within gwcelery to be reported to GraceDb in a DQR-compatible format for inclusion in these reports at all tiers.
Questions
The DQR also organizes follow-up tasks according to high-level questions they attempt to answer. Typically, we say that each task is a technical solution to answer a high-level question. Within each tier, technical solutions are organized into different questions within the resulting html document, and therefore we refer to these high-level questions as questions.
States
Each technical solution must return a state. States must be one of the following (note states must be specified in all lower-case letters)
pass
fail
human_input_needed
error
These states are agglomerated together following the hierarchical structure laid out above to compute a global state. Technical solutions within a question are grouped together to find the overall state of that question. Questions within a tier are grouped together to compute the overall state of the tier, and tiers are grouped together to determine the report’s overall state. This allows analysts to easily track down which tier and question are responsible for the overall state of the report.
If any technical solution fails the candidate, the candidate fails.
If all technical solutions pass the candidate, the candidate passes.
If any technical solution requires human input, then the report warns the user that human input is needed.
If any technical solution raises an error when completing, the report warns developers that an error was encountered.
These are the only states allowed within the DQR.
We also note that separate tasks may be allowed return only a subset of the known states. If they return a state they are now allowed to, it will be rendered as a bad_state and treated equivalently to an error in the summary logic.
Toggles
Each task may specify toggles to which it subscribes. These toggles allow users to show/hide sets of tasks within the html document. All state logic is rendered using only the tasks that have at least one toggle active (shown). Although not limited to this use case, we expect this to be used almost exclusively to separate tasks into groups associated with each interferometer.